Statistical light bulb
On this page I present my unstructured thoughts about statistics and epidemiology from time to time.
Finding evidence in the context of uncertainty is challenging.
Population and sample (July 4, 2022)Collinearity and confounding bias (February 11, 2022)
Role of variables in epidemiological studies (February 7, 2022)
Number converter between risks, incidences, percentages and decimals. (February 4, 2022)
Surprisal S-value: let's toss a coin to understand the value of a p-value (February 4, 2022)
Avoid categorization of a continuous variable (February 15, 2018)
Confusion caused by the p-value (November 17,2017)
Principles of statistical analysis (November 15, 2017)
Collinearity and confounding bias
February 11, 2022Collinearity occurs when there is a (strong) linear relationship between two or more regression variables in a regression model. Collinearity can then lead to inflated variances for the estimated coefficients and (in nonlinear models) bias in the estimated coefficients. A common solution in such situations is to remove one of the collinear variables from the model, although this may lead to confounding bias if the removed variable is a confounder (Porta, M. (Ed.). (2014). A dictionary of epidemiology. Oxford university press).
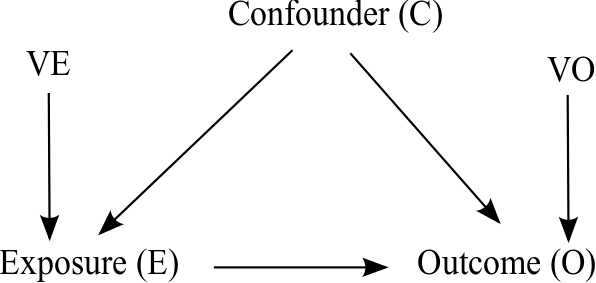
Correlated adjustment variables in a regression model are useful, for example, in order to be able to take confounding variables into account when causal questions are to be answered (explanatory modeling). Modeling should take into account the assumed causal structure, otherwise biased effect estimates may occur.
If you want to justify which variables should or should not be included in a regression model, just read this: "A Crash Course in Good and Bad Controls" by Cinelli C, Forney A, and Pearl J. see https://ftp.cs.ucla.edu/pub/stat_ser/r493.pdf
Confounding and collinearity on https://sumanmathmedicine.blogspot.com/2014/03/confounding-collinearity.html

Article
Schisterman EF, Perkins NJ, Mumford SL, Ahrens KA, Mitchell EM. Collinearity and Causal Diagrams: A Lesson on the Importance of Model Specification. Epidemiology. 2017 Jan;28(1):47-53. doi: 10.1097/EDE.0000000000000554