Statistical light bulb
On this page I present my unstructured thoughts about statistics and epidemiology from time to time.
Finding evidence in the context of uncertainty is challenging.
Population and sample (July 4, 2022)Collinearity and confounding bias (February 11, 2022)
Role of variables in epidemiological studies (February 7, 2022)
Number converter between risks, incidences, percentages and decimals. (February 4, 2022)
Surprisal S-value: let's toss a coin to understand the value of a p-value (February 4, 2022)
Avoid categorization of a continuous variable (February 15, 2018)
Confusion caused by the p-value (November 17,2017)
Principles of statistical analysis (November 15, 2017)
Role of variables in epidemiological studies
February 7, 2022
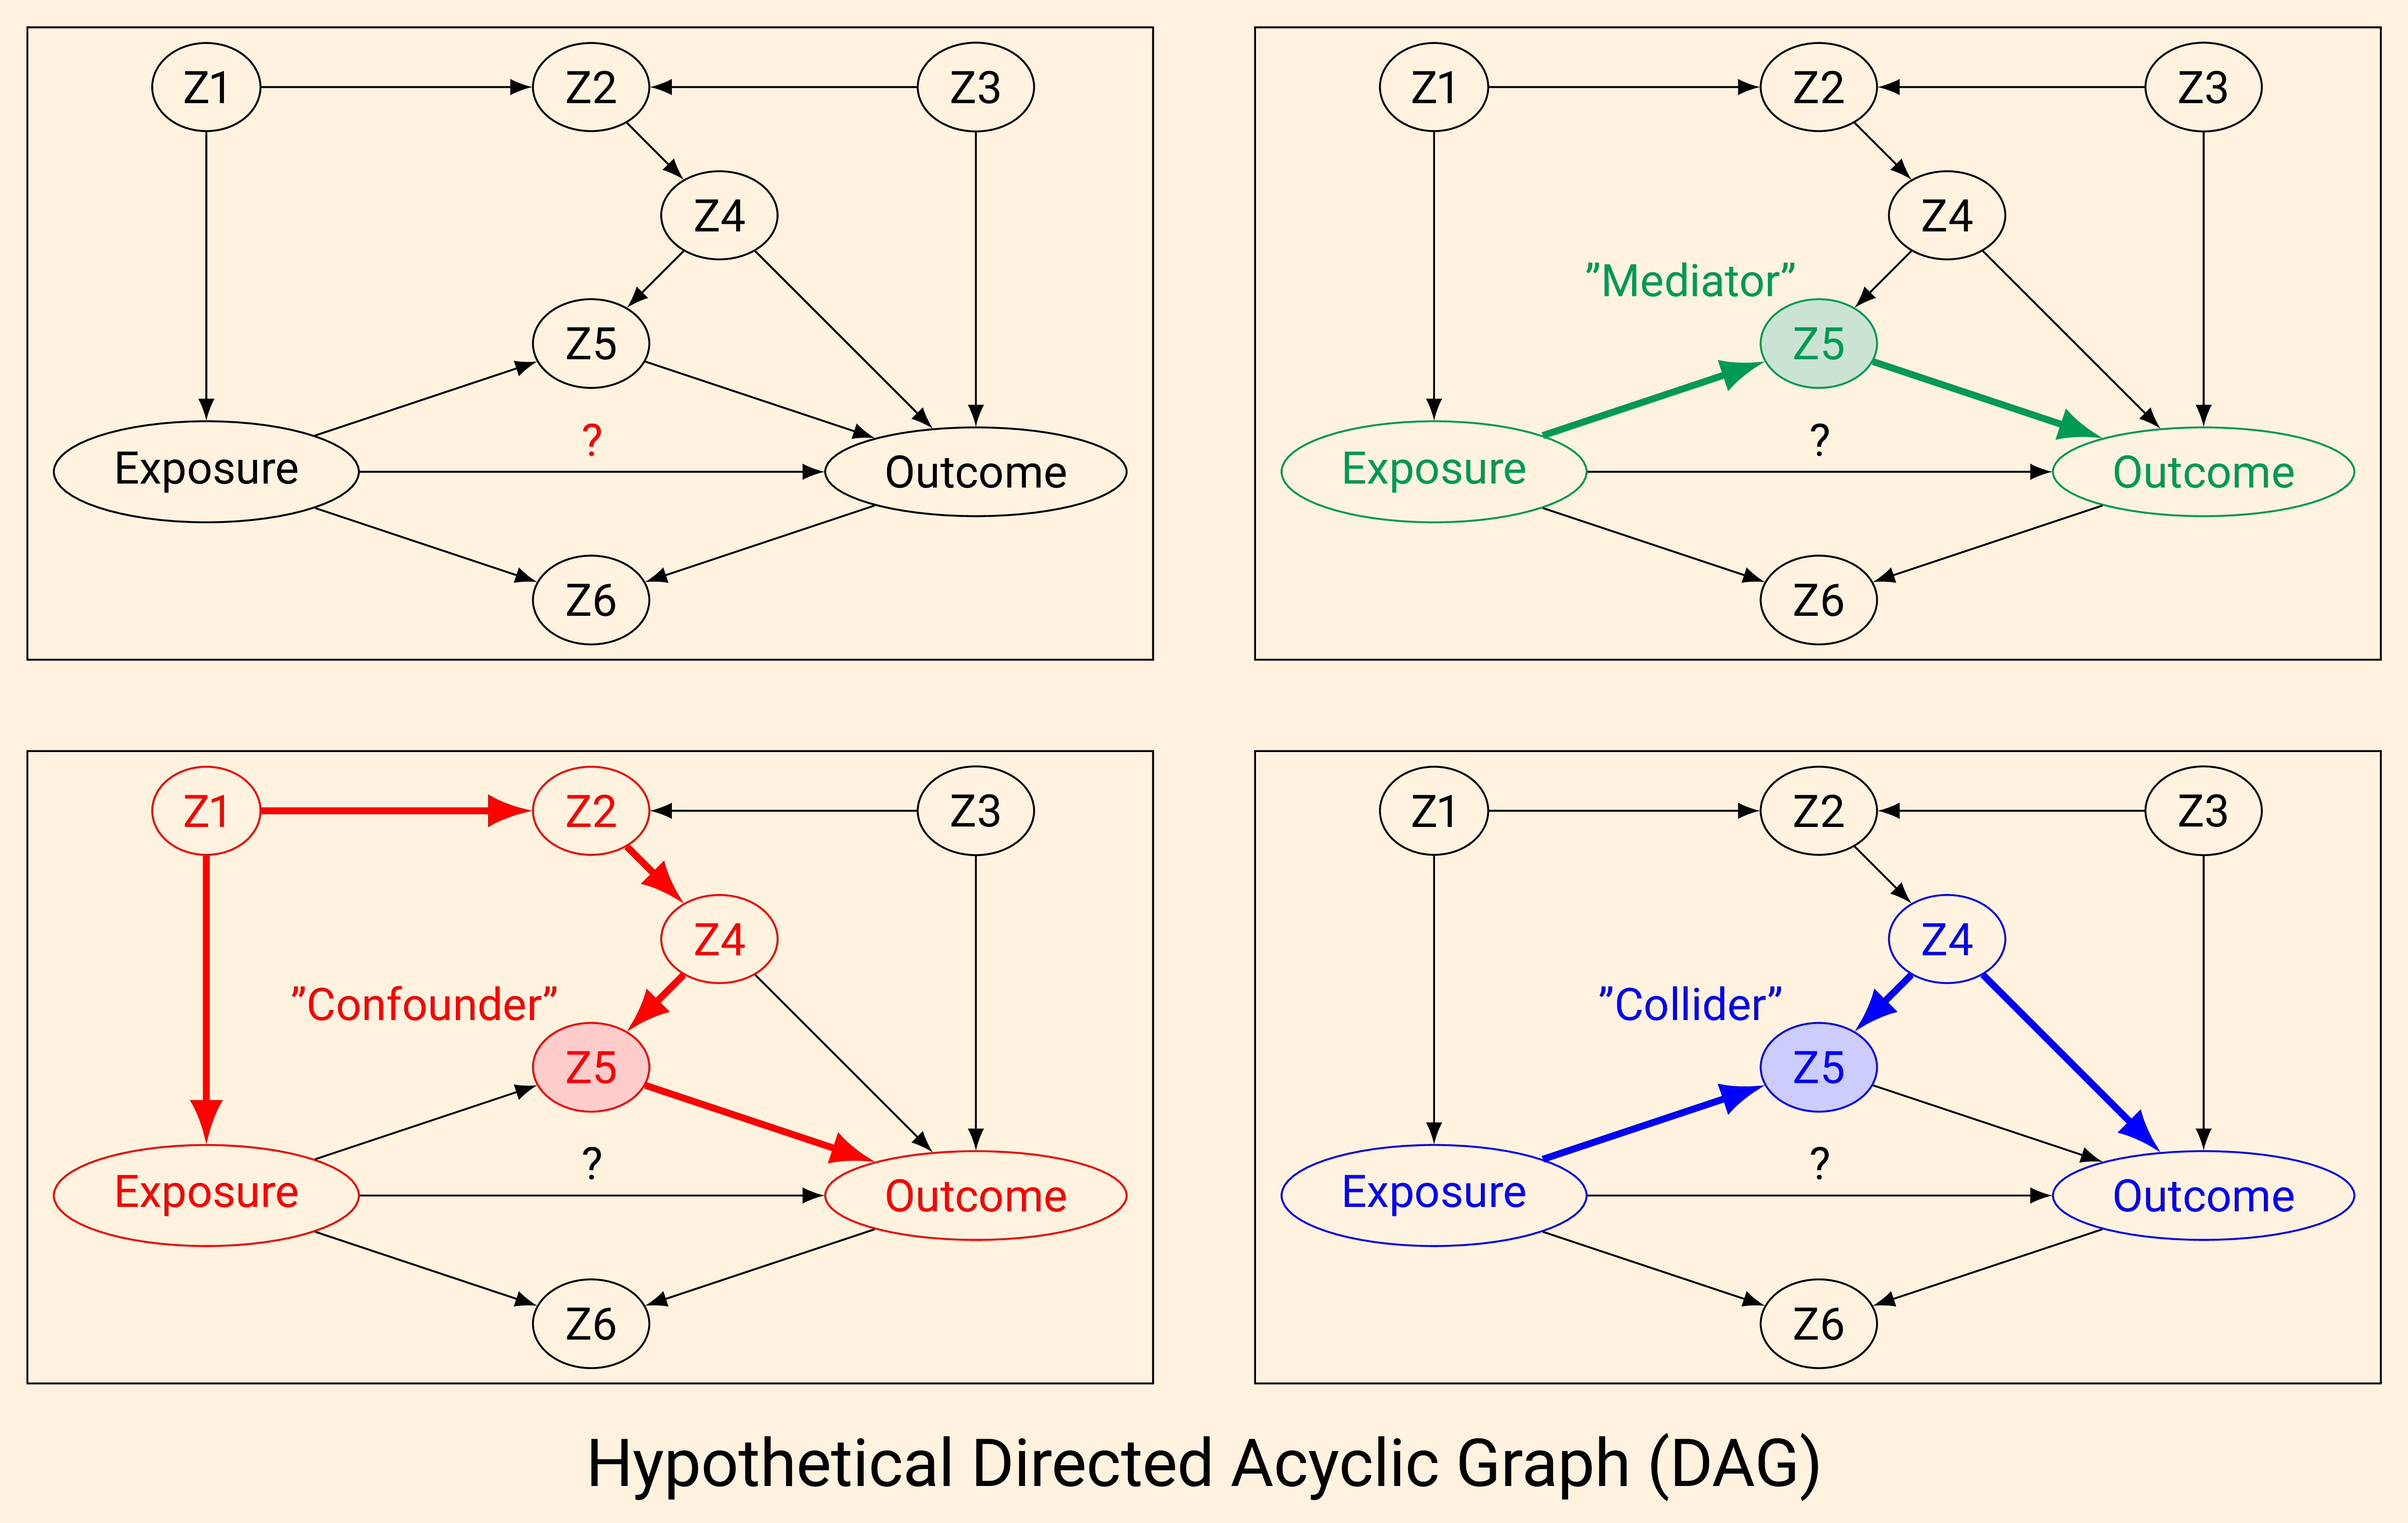
Using directed acyclic graphs (DAGs), the role is path-dependent. In the DAG shown, Z5 can be classified as a
mediator (E → Z5 → O),
confounder (E ← Z1 → Z2 → Z4 → Z5 → O),
or collider (E → Z5 ← Z4 → O).

If you want to justify which variables should or should not be included in a regression model, just read this: "A Crash Course in Good and Bad Controls" by Cinelli C, Forney A, and Pearl J. see https://ftp.cs.ucla.edu/pub/stat_ser/r493.pdf